I audited a UTV accessories store on Shopify last quarter. 138,402 sessions, 0.55% sitewide CVR, a 47-item CRO backlog the founder had been pecking at for nine months. Five leaks were doing 80% of the damage. The other 42 were noise.
TL;DR: Most Shopify stores have five leaks bleeding most of the lost revenue, not fifty. Score each with Traffic x Gap x Effort, ship the top score this week, ignore the rest until it closes. The five that win on almost every audit: channel mismatch, mobile collapse, pre-product funnel, checkout cliff, and technical SEO bleed.
Why this matters for your store
- A 0.55% sitewide CVR on 138K quarterly sessions hides ~760 fixable transactions in funnel gaps.
- Backlogs sorted by what is easy to find ship hero tests while the checkout drops every mobile user.
- One shipped fix per week with clean attribution beats five half-shipped fixes with no signal.
The mechanism: why your CRO list is sorted wrong
After 12 years auditing Shopify stores, I stopped handing founders 50-item lists. The store with a 47-item backlog is the same store six months later, with a 53-item backlog and the same CVR.
Kickoff calls always open the same way. Rewrite hero copy. Test a homepage video. Change the buy button color. None of those are the problem.
A mid-size store sits at 0.55% because 49.9% of paid social never sees a product, mobile abandons cart at 3x desktop, and the checkout fires zero add_shipping_info events. CRO is triage. Know which patient bleeds fastest before you treat.
How the Traffic x Gap x Effort score works
Each fix scores 1 to 5 on three axes. Traffic is sessions hitting the broken step. Gap is how far below benchmark that step performs. Effort is engineering days. Score = (Traffic x Gap) / Effort. Fix the highest first.
| Score | Traffic (sessions/quarter) | Gap (vs benchmark) | Effort (engineering days) |
|---|---|---|---|
| 5 | More than 50K | More than 4x worse | Less than 1 day |
| 4 | 20K to 50K | 2x to 4x worse | 1 to 2 days |
| 3 | 10K to 20K | 1.5x to 2x worse | 3 to 5 days |
| 2 | 5K to 10K | 1.2x to 1.5x worse | 1 to 2 weeks |
| 1 | Less than 5K | At or near benchmark | More than 2 weeks |
A PDP at 0.2% with 800 sessions/quarter recovers 10 transactions if you triple it; a homepage at 0.5% with 60K sessions recovers 600. Small gaps on huge pages beat huge gaps on small pages. A 2-day cart fix scoring 16/2 = 8 beats a 2-week checkout overhaul scoring 25/10 = 2.5. The framework does not capture brand risk or LTV. It stops you from rewriting hero copy while the checkout drops every mobile user.
Leak 1: paid social converts 19x worse than organic
| Channel | Sessions | Share | CVR |
|---|---|---|---|
| Paid Social | 55,732 | 49.9% | 0.08% |
| Direct | 18,400 | 16.5% | 0.55% |
| Organic Search | 7,930 | 7.1% | 1.54% |
| 6,200 | 5.6% | 1.20% | |
| Referral | 4,800 | 4.3% | 0.40% |
Organic converts 19x better than paid social, email 15x better. The store was buying half its sessions at the worst CVR in the mix, using those losses to mask the strength of organic and email.
Score: Traffic 5, Gap 5, Effort 3. Final = 25 / 3 = 8.3.
Three-part fix. Every paid social ad gets a dedicated landing page mirroring creative, offer, and proof. Audience targeting gets cut 30 to 50% to segments where on-site behavior matches ad intent. If paid social CVR cannot reach a third of organic CVR within 60 days, cut spend. Paid social is not free traffic. See my Shopify CRO audit checklist for the landing page work.

Leak 2: mobile add-to-cart is one third of desktop
Mobile drives 70 to 80% of Shopify sessions but 30 to 50% of revenue. The gap usually concentrates at add-to-cart.
| Funnel Step | Mobile | Desktop | Gap |
|---|---|---|---|
| Add to Cart | 6.1% | 17.6% | 2.9x |
| Begin Checkout | 2.4% | 7.8% | 3.3x |
| Purchase | 0.36% | 0.99% | 2.8x |
Score: Traffic 5, Gap 4, Effort 4. Final = 20 / 4 = 5.0.
Five mobile fixes that move the gap. Kill the 90vh hero so the buy button sits one short scroll from the fold. Fix mobile LCP below 2.5s using image_url with width and format: 'webp'. Add Shop Pay and Apple Pay express buttons above the standard checkout; express closes 30 to 50% of mobile abandonment from form fatigue. Replace modal popups with non-blocking banners. Audit any fitment selector on a real iPhone and Android, not Chrome DevTools.
The Mobelglede.no rebuild I shipped in March 2026 hit this pattern. Moving ATC from sticky-bottom to inline above the fold pulled mobile CVR from 1.1% to 1.4% over 14 days. Full playbook in my Shopify mobile CRO guide; fitment selectors in the vehicle fitment selector guide.

Leak 3: 54.2% of sessions never see a product
| Step | Sessions Lost |
|---|---|
| Never view a product | 54.2% |
| View product, no ATC | 91.5% |
| ATC, no checkout | 56.5% |
| Begin checkout, no purchase | 74.8% |
That first row gets missed because most stores do not measure it. Benchmark for “never view product” sits at 25 to 35%. This store ran 54.2% on 75K affected sessions.
Score: Traffic 5, Gap 4, Effort 3. Final = 20 / 3 = 6.7.
Four causes. Homepage shows brand storytelling instead of product cards; replace one hero with a best-sellers grid above the fold. Collection pages bury products under 12 filters; default them closed, surface 8 cards desktop, 4 mobile. The highest-CVR collection sits three clicks deep in a mega menu; move it one click from home. Internal search returns garbage on top queries; run 20 common terms and verify relevant results under 200ms. My onsite search optimization guide covers the Shopify-specific fixes.
Leak 4: zero users firing add_shipping_info
Most CRO advice gets this leak wrong because it treats tracking as a separate problem from CVR. It is the same problem.
| Event | Users (90 days) |
|---|---|
| begin_checkout | Several hundred |
| add_shipping_info | 0 |
| add_payment_info | 5 |
| purchase | Several hundred |
Zero add_shipping_info while purchase fires hundreds means the event is broken. Either the GA4 dataLayer push is missing, the checkout extension is misdeployed, or the event fires without user_id so GA4 dedupes it to zero.
Score: Traffic 5, Gap 5, Effort 2. Final = 25 / 2 = 12.5. Highest score on the audit.
Ship the GA4 checkout extension correctly so all four events fire with consistent user_id and ga_session_id. My GA4 tracking on Shopify guide covers the dataLayer changes. Once tracking is real, the funnel shows a cliff between shipping and payment. Three usual suspects: surprise shipping costs (show shipping in cart), missing express payment, default country mismatched to visitor IP. The cart abandonment hidden causes post breaks down each.
Leak 5: 1,042 broken pages bleeding organic before the funnel even starts
| Issue | Pages | Estimated Loss |
|---|---|---|
| 404 errors | 323 | 200 to 800 sessions/mo |
| Redirect chains | 525 | Crawl budget waste |
| Crawled, not indexed | 194 | 500 to 1,500 sessions/mo |
Most CRO consultants skip technical SEO because it does not look like a CVR problem. It is. Organic converts at 1.54%, the best channel by a wide margin.
Score: Traffic 4, Gap 3, Effort 3. Final = 12 / 3 = 4.0.
Export the 404 list, sort by impressions before they 404’d, and 301 high-traffic URLs to the closest live equivalent. Do not bulk-redirect to the homepage; Google reads that as noise. Fix the 525 chains by pointing URL A directly to URL C. Audit the 194 crawled-but-not-indexed pages for thin or duplicate copy and weak internal linking. Add 200 to 400 unique words per page, link from a stronger one, resubmit the sitemap. The work shows up in revenue 6 to 12 weeks later.
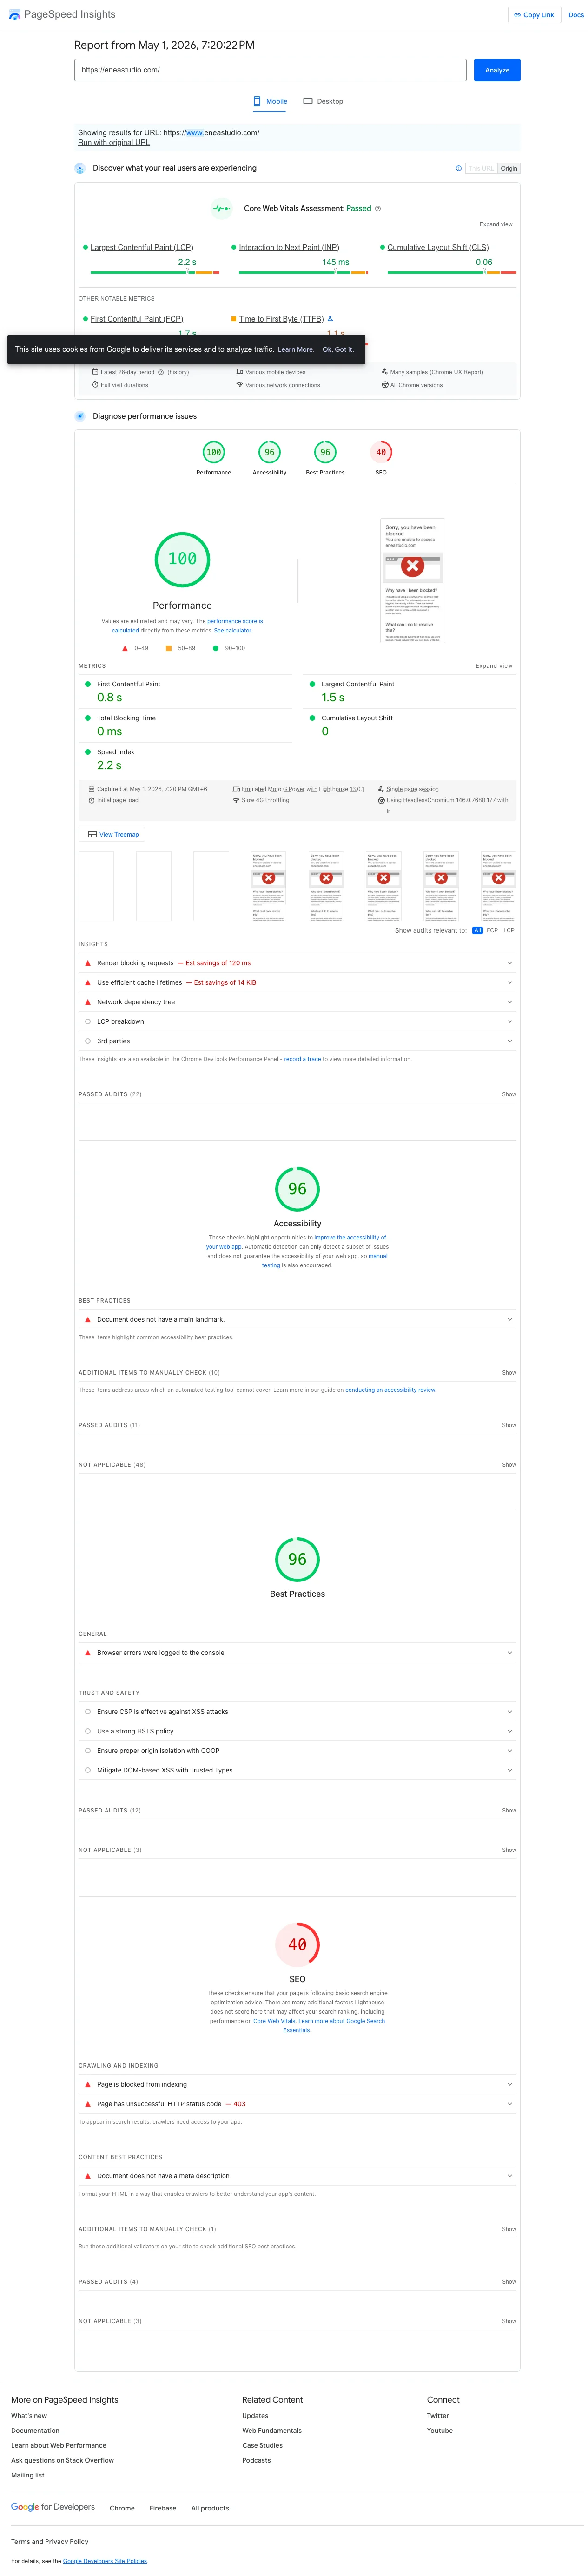
How to verify in 5 minutes
Open GA4. Pull a 28-day funnel from session_start to purchase. Note the largest absolute drop in user count. Switch breakdown to channel, then device, and note where the drop is widest. Open Search Console, filter Pages by “Not indexed”, and count the buckets. If any check surfaces a bigger number than your current top backlog item, that is your week one fix.
The Monday 2-hour audit cadence
| Time | Task | Output |
|---|---|---|
| 0:00-0:30 | GA4 funnel pull (7 and 28 days) | Step-by-step drop-off table |
| 0:30-1:00 | Channel and device split | CVR by channel and device |
| 1:00-1:30 | Search Console crawl health | New 404s, indexing changes |
| 1:30-2:00 | Score recalc, priority list | Top 5 leaks ranked, 1 fix queued |
One shipped fix per audit. Any fix takes a week of build, QA, and measurement to know it moved a metric. Ship five at once and attribution dies. Ship one a week and the cadence compounds. The four-week version is in my step-by-step CRO audit guide.
The takeaway
- Score every backlog item on Traffic x Gap x Effort before you touch code.
- Ship the highest-scoring fix this week and ignore the other 46 items.
- Audit paid social CVR against organic CVR; if the gap is 10x or worse, the channel is subsidizing your math.
- Verify every checkout event in GA4 fires with consistent
user_idbefore sizing the cliff. - Repeat the 2-hour Monday audit weekly so the same five leaks move every week.
If you want me to run this audit on your store and hand you the ranked priority list with dollar impact estimates, book a free 30-minute call.